D O C U M E N T 8 M A Y 1 9 2 0 1 5 5
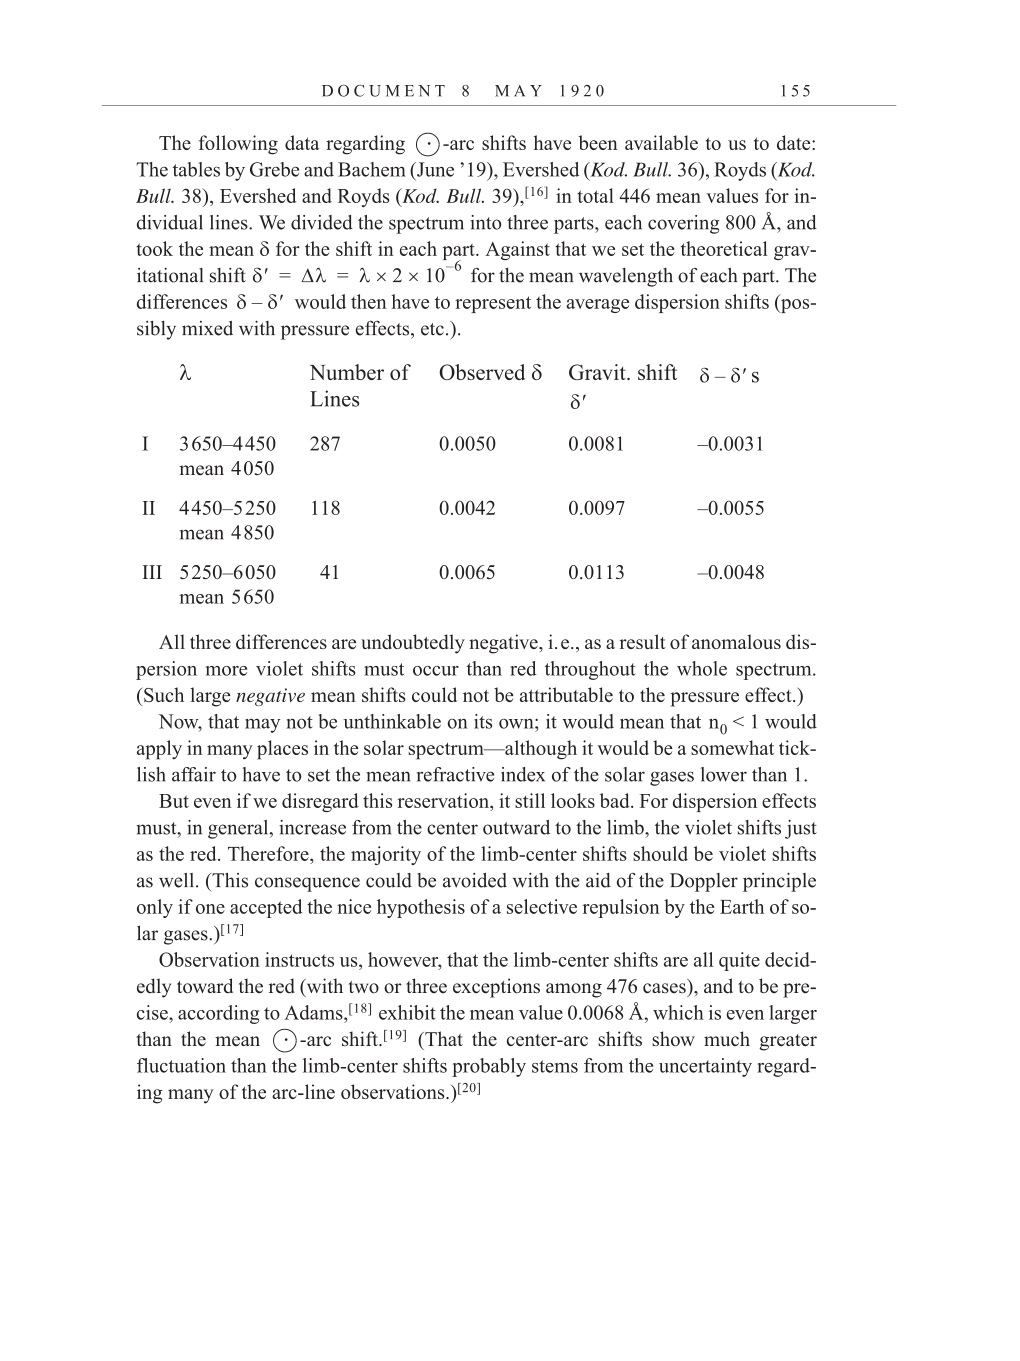
The following data regarding -arc shifts have been available to us to date:
The tables by Grebe and Bachem (June ’19), Evershed (Kod. Bull. 36), Royds (Kod.
Bull. 38), Evershed and Royds (Kod. Bull.
39),[16]
in total 446 mean values for in-
dividual lines. We divided the spectrum into three parts, each covering 800 Å, and
took the mean for the shift in each part. Against that we set the theoretical grav-
itational shift for the mean wavelength of each part. The
differences would then have to represent the average dispersion shifts (pos-
sibly mixed with pressure effects, etc.).
All three differences are undoubtedly negative, i.e., as a result of anomalous dis-
persion more violet shifts must occur than red throughout the whole spectrum.
(Such large negative mean shifts could not be attributable to the pressure effect.)
Now, that may not be unthinkable on its own; it would mean that would
apply in many places in the solar spectrum—although it would be a somewhat tick-
lish affair to have to set the mean refractive index of the solar gases lower than 1.
But even if we disregard this reservation, it still looks bad. For dispersion effects
must, in general, increase from the center outward to the limb, the violet shifts just
as the red. Therefore, the majority of the limb-center shifts should be violet shifts
as well. (This consequence could be avoided with the aid of the Doppler principle
only if one accepted the nice hypothesis of a selective repulsion by the Earth of so-
lar
gases.)[17]
Observation instructs us, however, that the limb-center shifts are all quite decid-
edly toward the red (with two or three exceptions among 476 cases), and to be pre-
cise, according to
Adams,[18]
exhibit the mean value 0.0068 Å, which is even larger
than the mean -arc
shift.[19]
(That the center-arc shifts show much greater
fluctuation than the limb-center shifts probably stems from the uncertainty regard-
ing many of the arc-line
observations.)[20]
Number of
Lines
Observed Gravit. shift
s
I 3650–4450
mean 4050
287 0.0050 0.0081 –0.0031
II 4450–5250
mean 4850
118 0.0042 0.0097 –0.0055
III 5250–6050
mean 5650
41 0.0065 0.0113 –0.0048
·
2 10
6–
= =
–
–
n0 1
·